Submitted by gbatchelor on July 1, 2016 - 10:31am
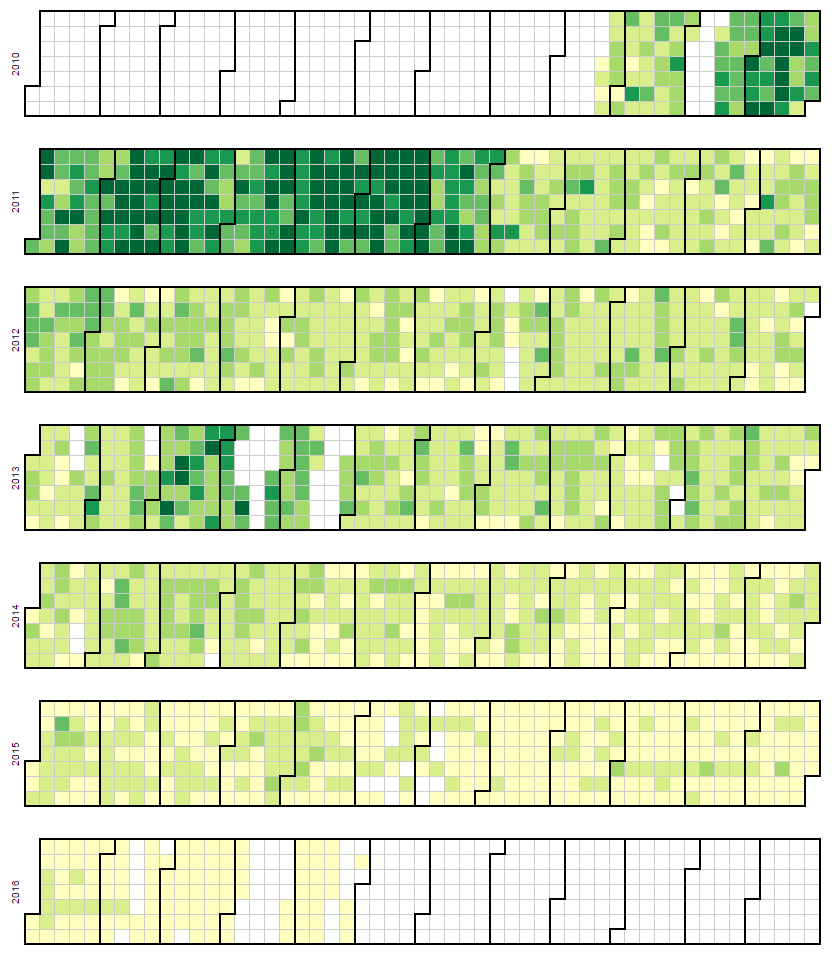
Django IRC D3 CONTRIBUTIONS GRAPH
This graph represents The number of posts in the Django IRC logs. The lighter green squares represent days with less posts than the darker green squares. Months go from left to right and are separated by the darker lines. Days go by columns from left to right.
Submitted by gbatchelor on June 29, 2016 - 11:41am
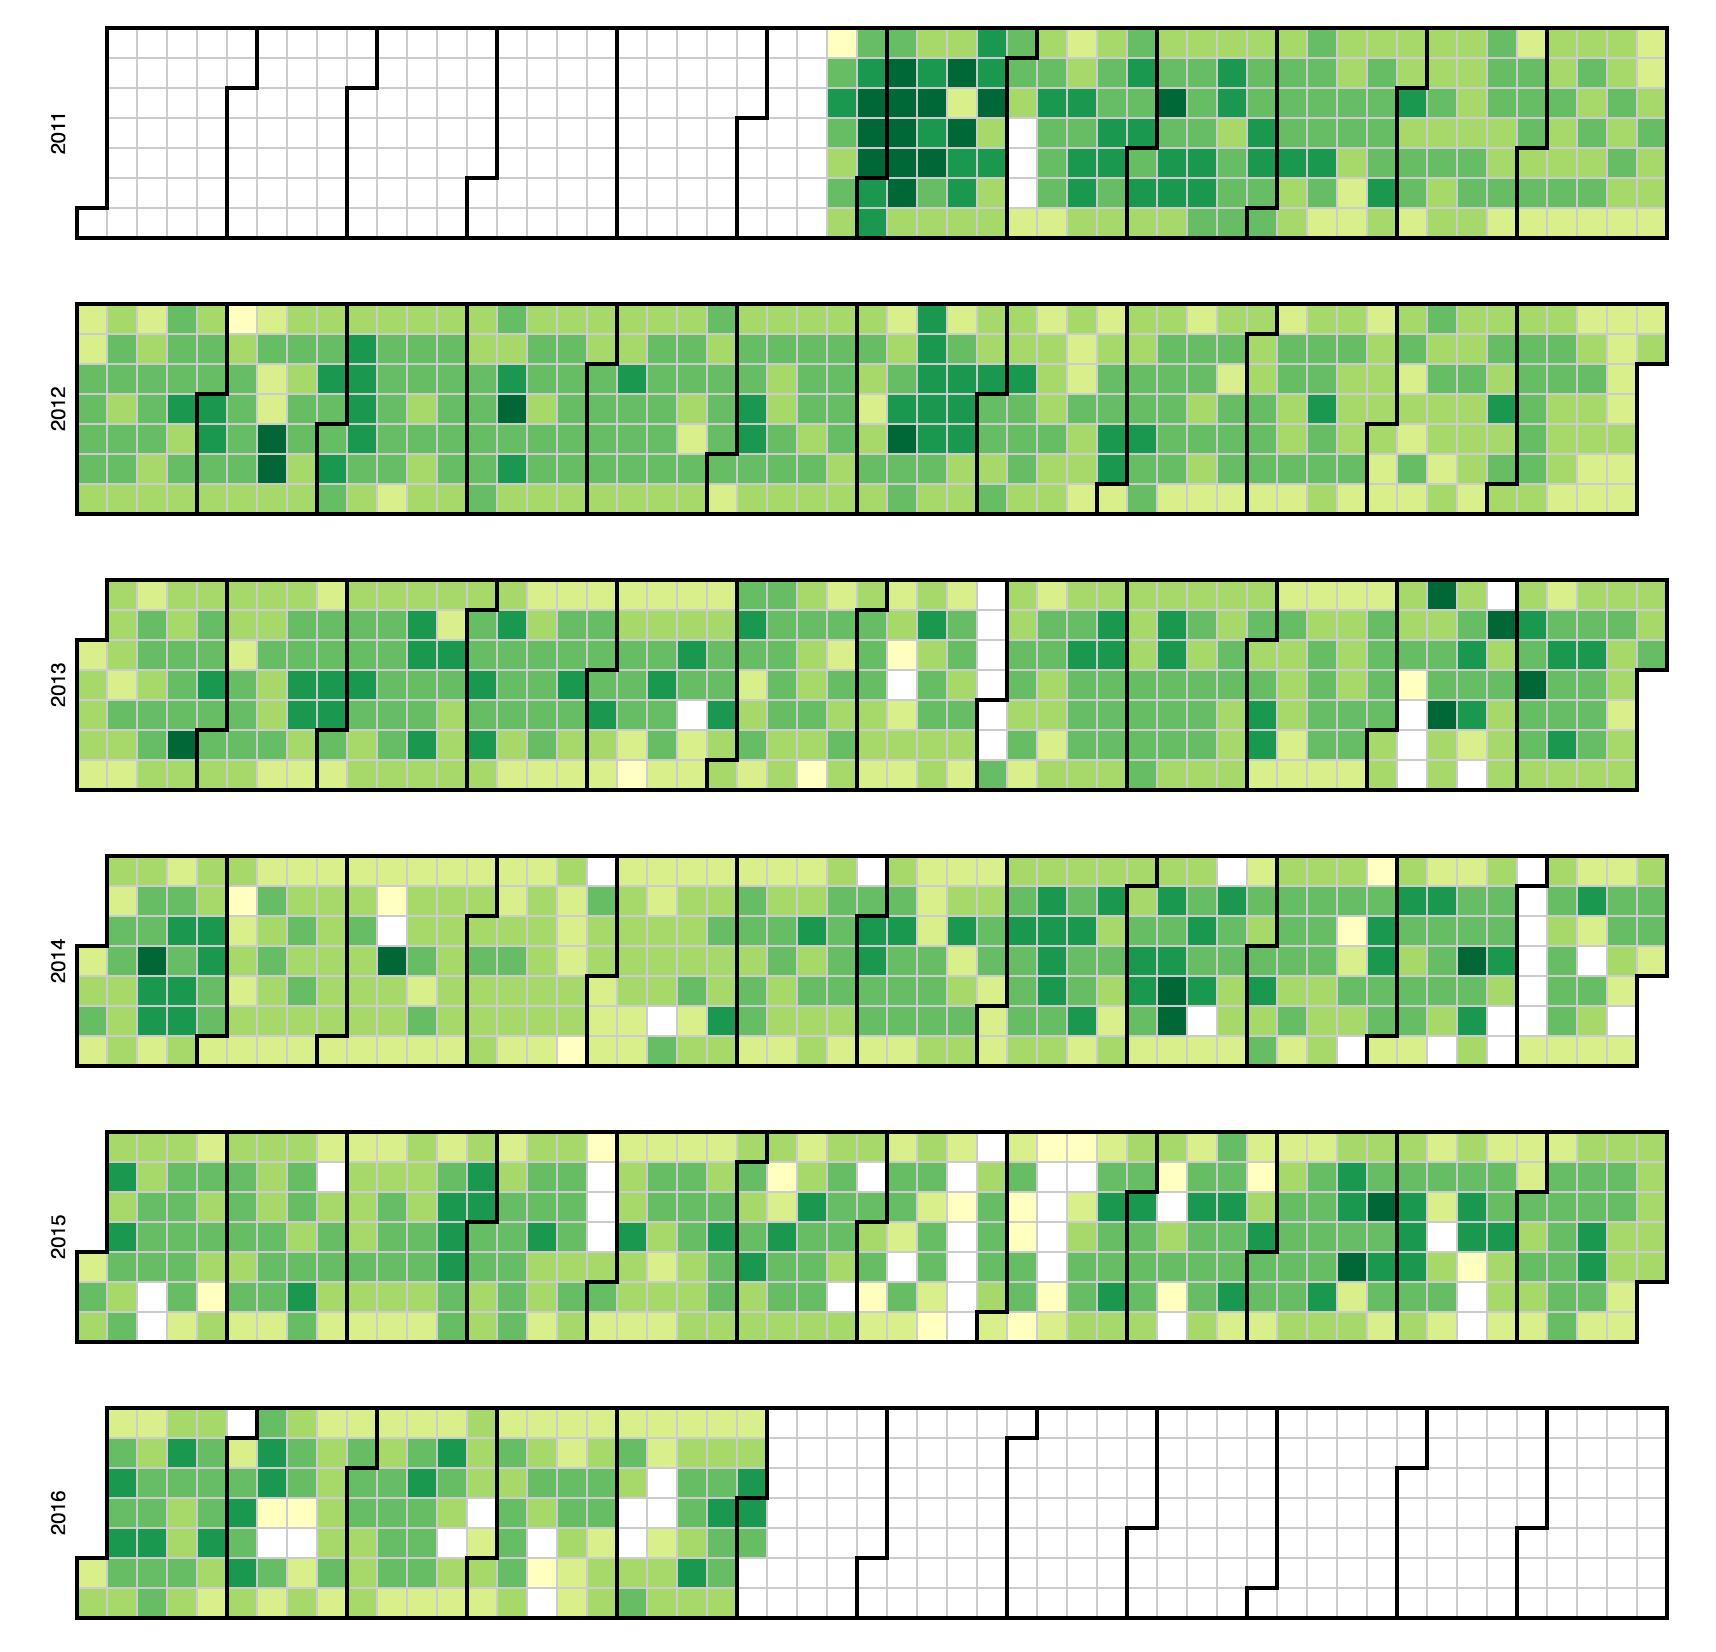
Ubuntu IRC D3 CONTRIBUTIONS GRAPH
This graph represents The number of posts in the UbuntuIRC logs. The lighter green squares represent days with less posts than the darker green squares. Months go from left to right and are separated by the darker lines. Days go by columns from left to right.
Submitted by gbatchelor on June 28, 2016 - 9:36am
The following are a few examples of some quick queries and visualizations we made to show how to use the Perl6 IRC data.
(1) Posts by hour of day over the years

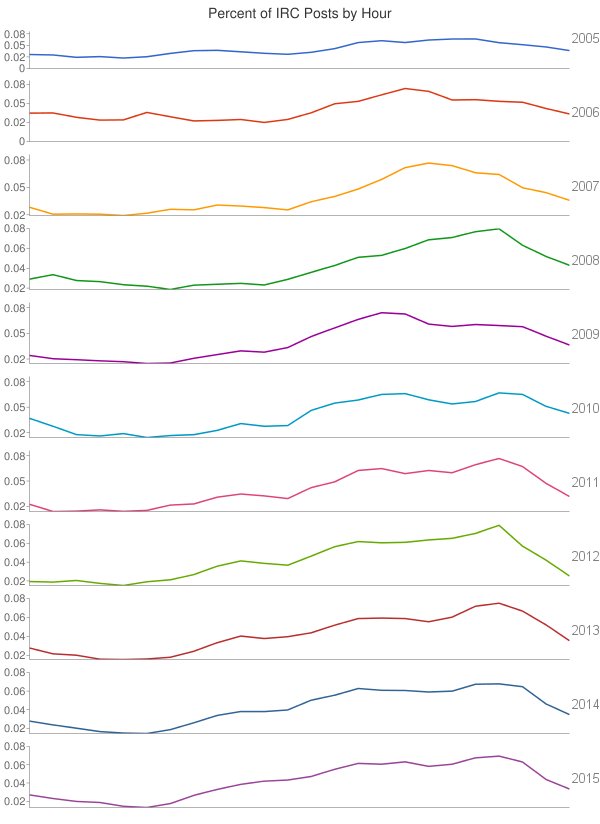
SQL code:
SELECT YEAR(`date_of_entry`),HOUR(`time_of_entry`),COUNT(HOUR(`time_of_entry`))
FROM `perl6_irc`
GROUP BY 1,2
(2) Perl6 IRC Posts by hour
Submitted by gbatchelor on June 23, 2016 - 12:27pm
Here are some graphs and SQL to show how to use the Bitcoin IRC data. These charts track the activity of three main developers of Bitcoin: Mike Hearn, Gregory Maxwell, and Gavin Andresen. These three developers were featured in a New York Times article about Bitcoin developers.
(1) Bitcoin Developers IRC Posts Over Time
Submitted by gbatchelor on June 23, 2016 - 9:55am
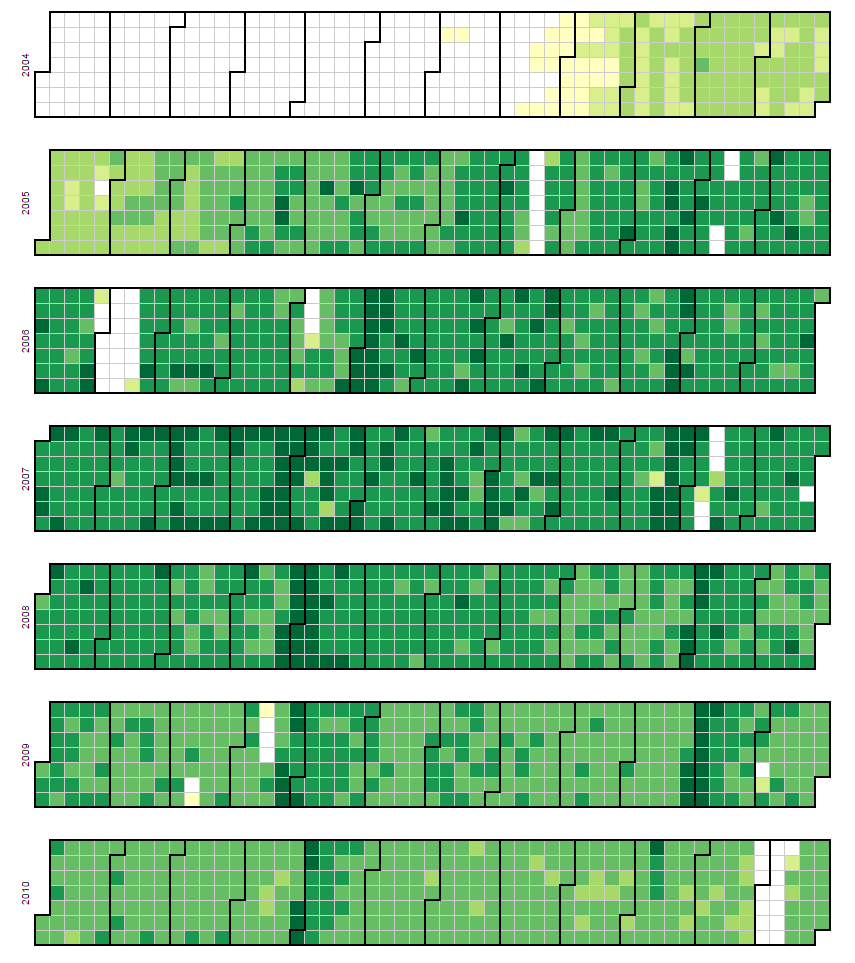
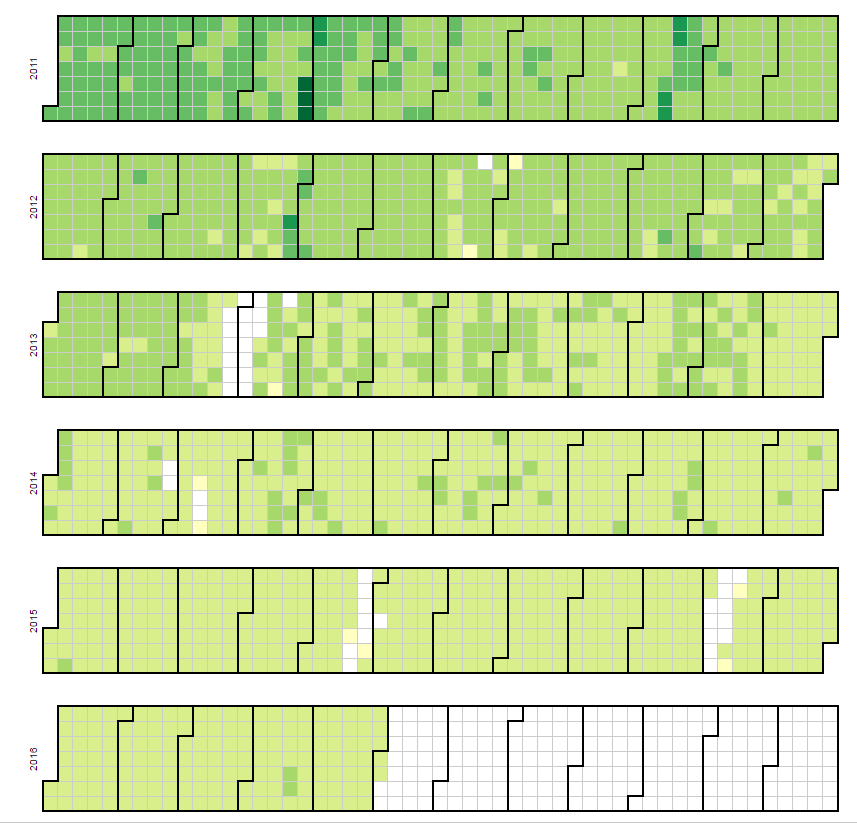
BITCOIN IRC D3 CONTRIBUTIONS GRAPH
This graph represents The number of posts in the Bitcoin IRC logs. The lighter green squares represent days with less posts than the darker green squares. Months go from left to right and are separated by the darker lines. Days go by columns from left to right.