Queries and visualizations to help people use data
Submitted by Anonymous on June 2, 2014 - 1:13pm
This chart shows the new project registrations for each year 1998-2014, and what programming language those projects were tagged with.
For example, 2003 was the highest year for new "C" projects to be registered with Freecode (then called Freshmeat).
Submitted by Anonymous on June 2, 2014 - 12:35pm
Rubyforge is a software development "code forge" associated with projects written in the Ruby programming language. This chart shows the growth of new projects registered on this forge from July 2003 - December 2013. We used datasource_id=317 in this example.
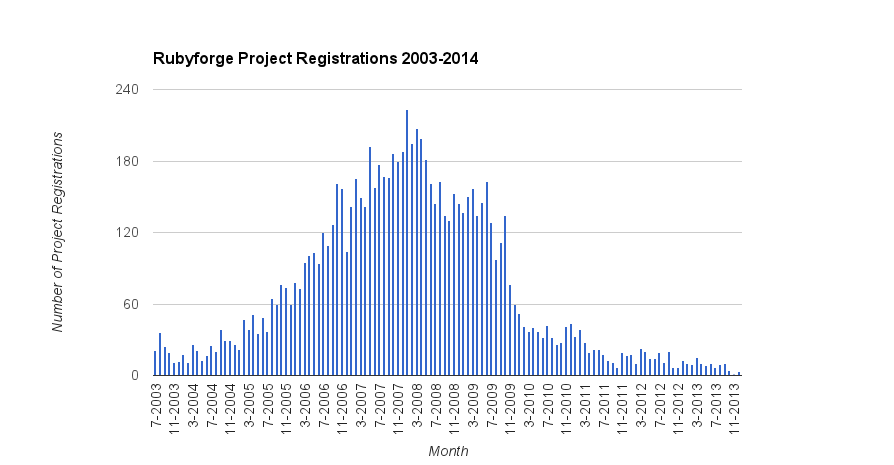
The SQL to generate the data used to populate this graph is as follows (fill in the datasource_id accordingly):
Submitted by Anonymous on June 2, 2014 - 12:22pm
Savannah is a free software code forge.
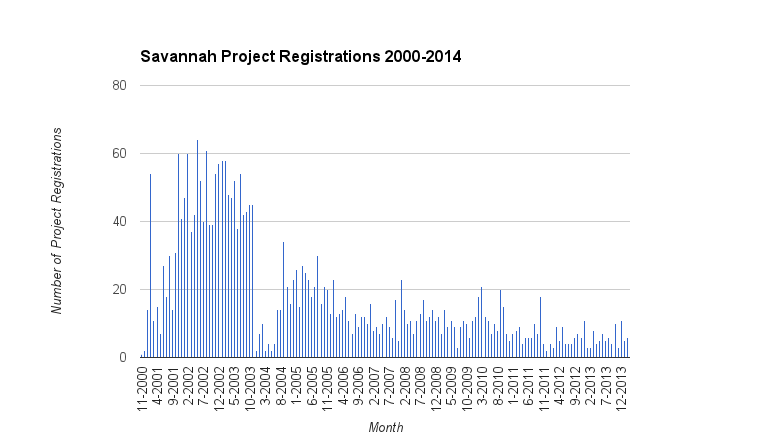
The SQL used to generate the data that made this chart is as follows:
SELECT CONCAT( MONTH( registration_date ) , '-', YEAR( registration_date ) ) , COUNT( DISTINCT project_name )
FROM sv_projects
WHERE datasource_id =8082
GROUP BY YEAR( registration_date ) , MONTH( registration_date )
ORDER BY YEAR( registration_date ) , MONTH( registration_date )
Submitted by Anonymous on June 2, 2014 - 12:09pm
Alioth is a Debian-centric code forge. We collect the information about projects hosted on this forge. This chart shows the creation of new projects on this forge from 2003-2014. The datasource_id used is 8084.
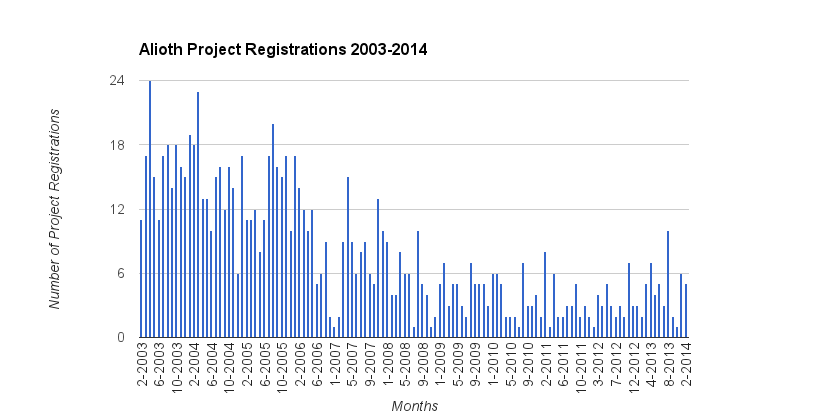
The SQL code used to generate the data to build this chart from FLOSSmole database is as follows:
Submitted by Anonymous on June 2, 2014 - 11:44am
We have collected Freecode (formerly Freshmeat) data since 2005. This chart shows the number of projects listed in the Freecode directory between 2005 and 2014. Each line represents one collection. (Collections are referred to in our database by the term "datasource_id".)
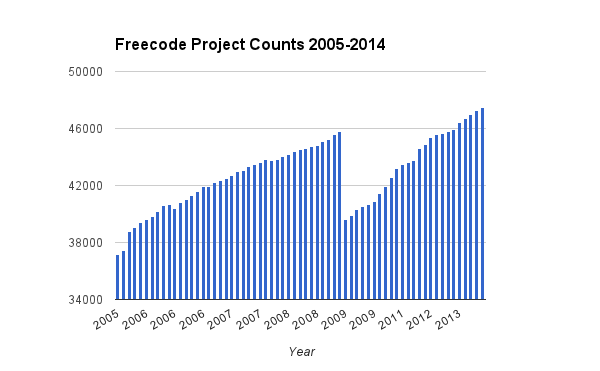
Here is the code used in the FLOSSmole database to generate the data list to create this graph:
Submitted by Anonymous on June 2, 2014 - 11:24am
This chart shows the 20 most popular licenses chosen by the projects on Freecode.
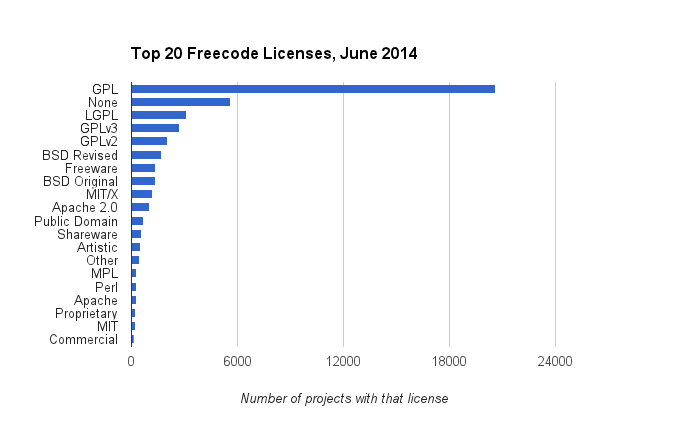
The SQL to get the data from FLOSSmole to build this chart is as follows:
SELECT f.license, count( f.project_id )
FROM fm_projects f
WHERE datasource_id=[current datasource_id]
GROUP BY 1
ORDER BY 2 DESC
LIMIT 20;
Submitted by Anonymous on June 2, 2014 - 11:12am
Freecode allows each project to declare which other projects it is dependent upon. Here is a chart showing the projects that were declared dependencies most frequently. PHP was the project selected most often by other projects as a dependency.
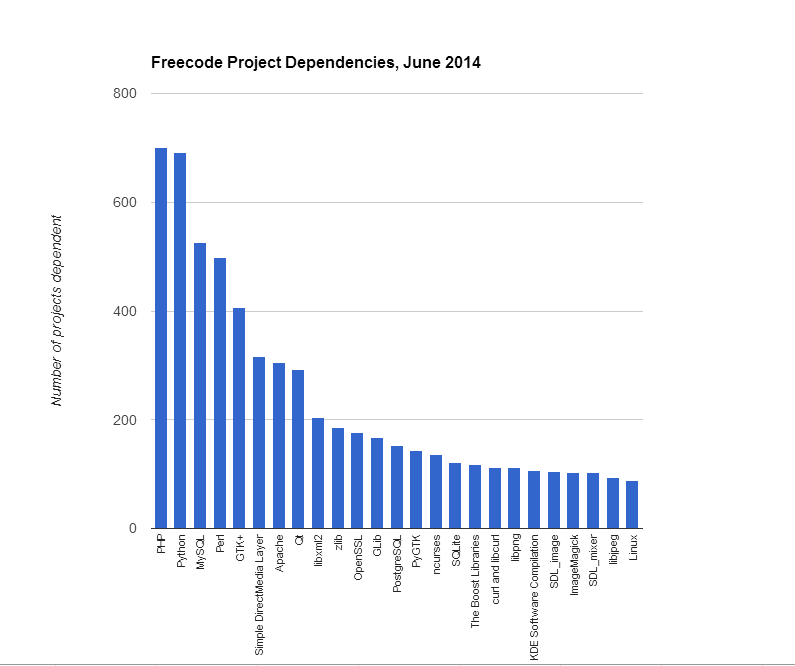
Here is the SQL code used to generate this data set from the FLOSSmole database:
Submitted by Anonymous on June 2, 2014 - 11:04am
Tigris lists the open source license that each project is using. The following chart shows the licenses used by projects on Tigris, and how many projects use each. Note that UNLIKE some other forges, variations of the GPL (and other licenses with multiple versions) are not differentiated by version, rather they are all lumped together.
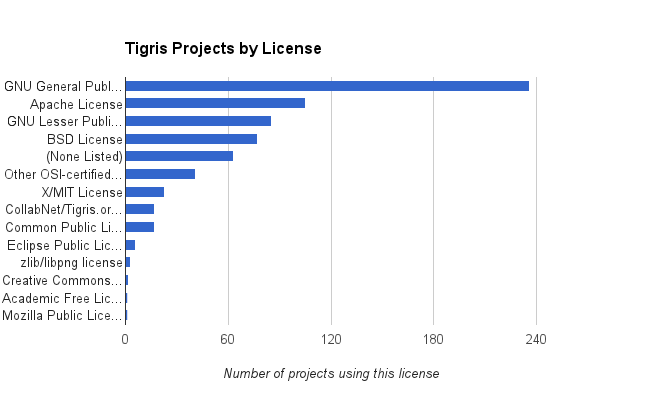
Here is the SQL needed to generate the data set from the FLOSSmole database:
Submitted by Anonymous on June 2, 2014 - 10:56am
Objectweb allows each project to state what license it uses. Here is a chart showing these licenses for all the projects on Objectweb, as of June 2014.
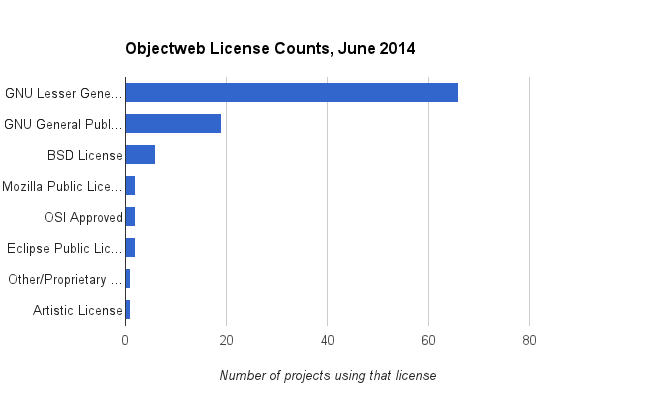
Here is the SQL code to generate the data set:
SELECT description, count( * )
FROM `ow_project_licenses`
WHERE datasource_id =8081
GROUP BY 1
ORDER BY 2 DESC;
Submitted by Anonymous on June 2, 2014 - 10:19am
Each project on Rubyforge can list what license it uses. The following chart was generated in June 2014 (datasource_id=12987) to show the most common licenses (all those with more than 10 projects using it) and how many projects.
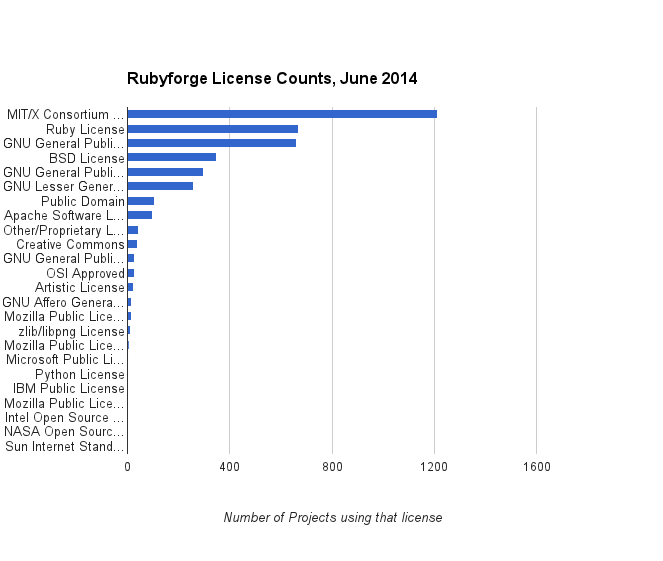
Here is the SQL code used to generate the data for this chart:
SELECT description, count( * )
FROM rf_project_licenses
WHERE datasource_id =[current datasource_id]
GROUP BY 1
ORDER BY 2 DESC;
Pages


