Examples

Queries and visualizations to help people use data

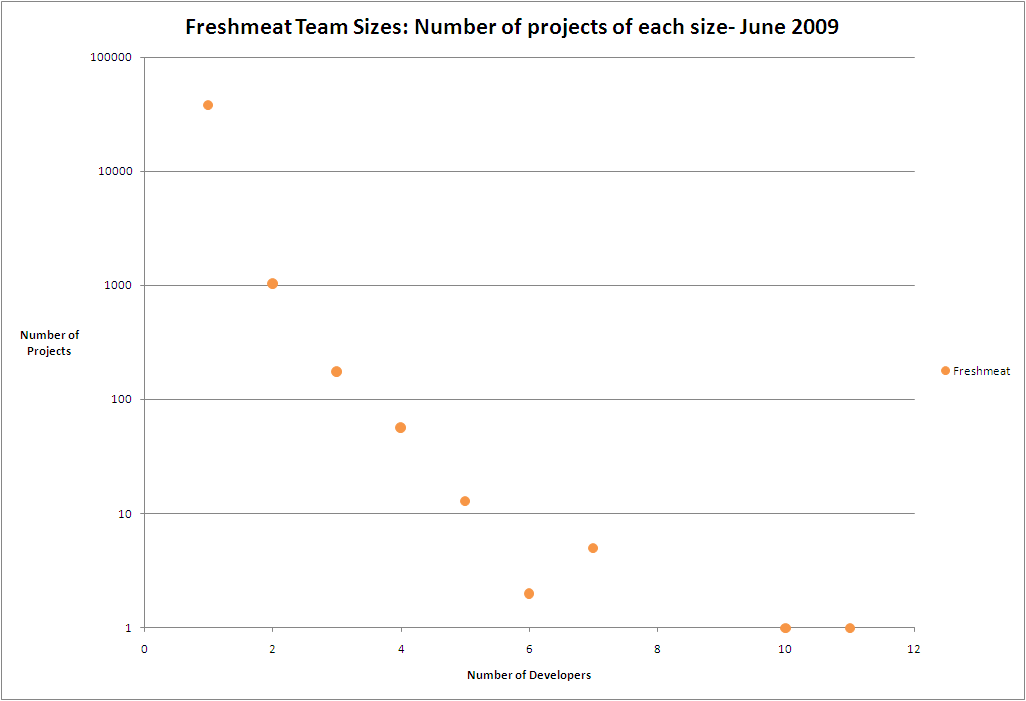
As of June 2009, how many projects of each team size are listed in Freshmeat?

Description

This chart shows the number of projects of each team size listed in Freshmeat.

Visualization

Projects listed as having 0 developers were disregarded (332 projects).

Freshmeat Developer Count Chart

Data Resources: 

As of June 2009, how many projects at each repository share URL's?

Description

This chart shows the number of projects at each repository that share URL's.

Visualization

Number of Projects at each Repository that List a Home Page at Another Repository

Data Resources: 

As of June 2009, how many projects at each repository share identical short project names?

Description

This chart shows the number of projects at each repository that share project names.

Visualization

Number of Projects at each Repository that Share an Identical Short Project Name

Data Resources: 

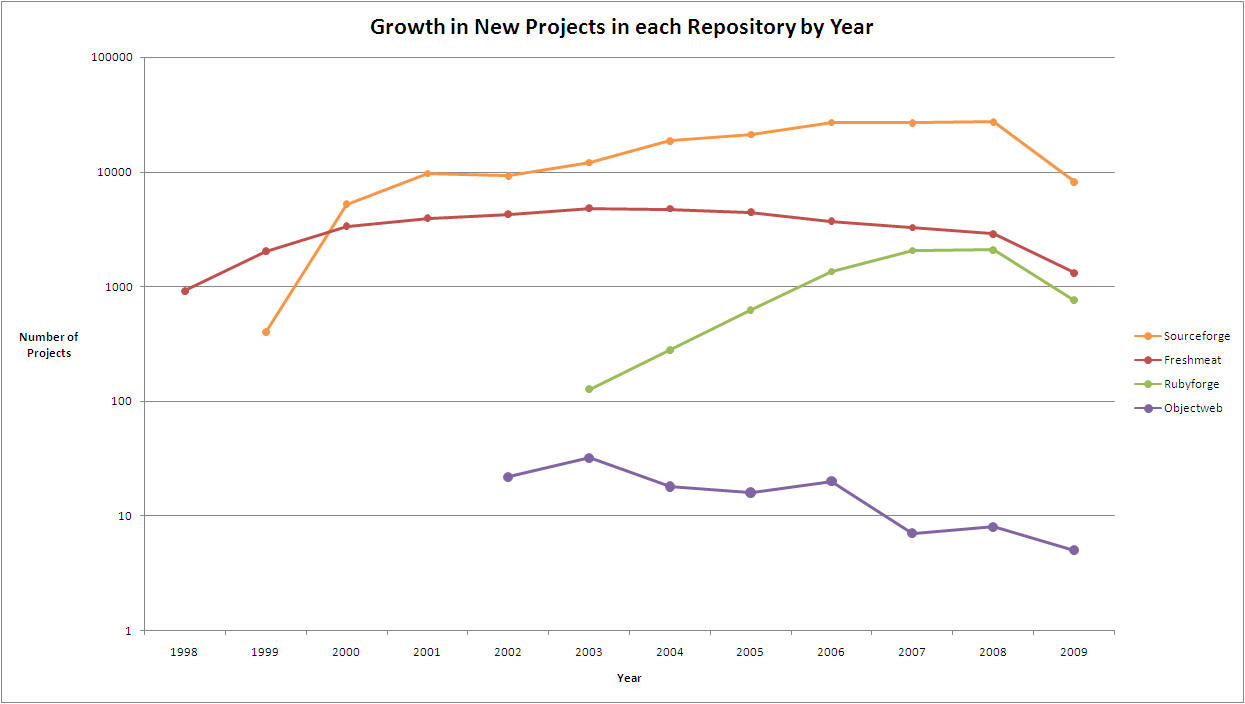
As of June 2009, how have projects in each repository grown by year?

Description

This chart shows the number of NEW projects added to each repository by year.

Visualization

Project Growth Chart

SQL Script

Data Resources: 

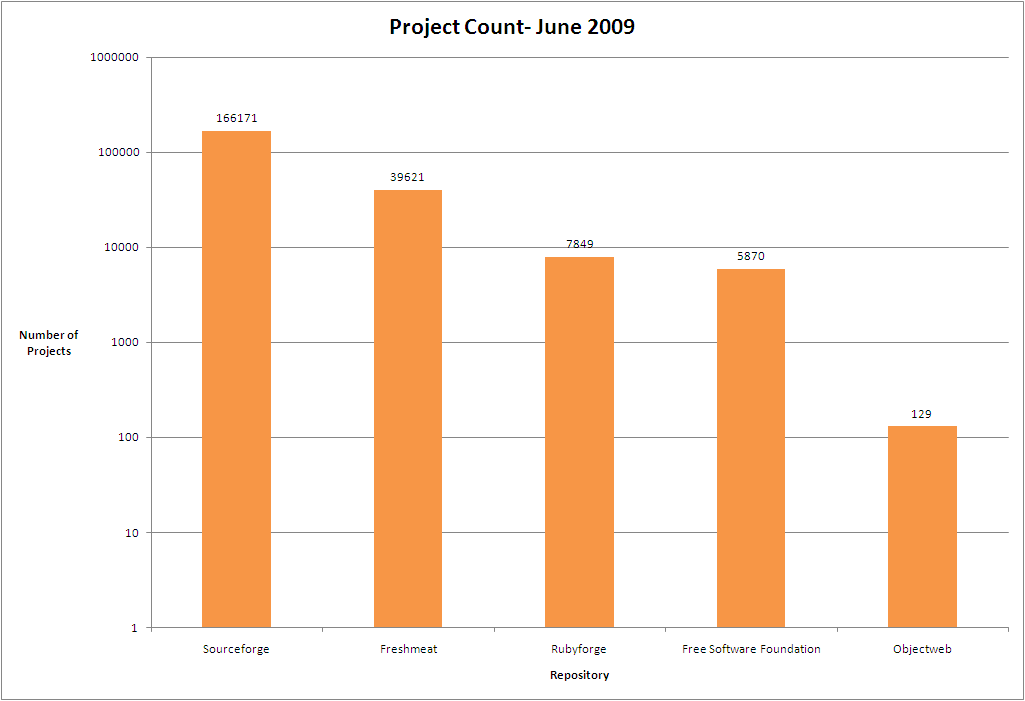
As of June 2009, how many projects are listed in each repository?

Description

This chart shows the number of projects that FLOSSmole most recently collected from each repository.

Visualization

Project Count Chart

SQL Script

SELECT count(DISTINCT proj_unixname) FROM projects
WHERE datasource_id= <current>;

Data Resources: 

Pages