Submitted by jhowison on April 9, 2005 - 5:06am
Submitted by jhowison on March 25, 2005 - 4:20am
As an example of the data and analysis in the system here is a graphic of developer counts over time, taken from the Project Summaries pages, developed by
James Howison and Kevin Crowston using the OSSmole data. The time series are sorted, programatically, into 6 categories, from constantly rising, mostly rising, not trending, mostly falling, consistently falling and dead projects.

Submitted by jhowison on March 24, 2005 - 1:11am
Submitted by megan on March 10, 2005 - 6:38pm
The following graph shows the relative popularity of the words 'free' and 'open' in naming new Sourceforge projects 11-1999 through 12-2004. Note that 1999 only includes 2 months worth of new project registration data (November and December), which is why the 1999 totals are much lower than the other years represented on the chart. However, 10 new projects in 1999 had 'free' in their names, while 'open' had only 9. In looking at the chart, we might surmise that during the years 2000-2001, 'open' became more the preferred term over 'free'.
Submitted by megan on March 10, 2005 - 2:56am
The OSSmole team has successfully imported data from
Dawid Weiss' crawl of Sourceforge from December 2004. (Moles: This information has datasourceID=4 in the database.) Thanks, Dawid, for making your data available and for donating it to this project!
Submitted by megan on March 7, 2005 - 1:08am
There's good news and there's bad news. The bad news is that we've found some problems with the developer data collected during the October 2004 run, namely that the last half of the letter 'z' (specifically project unixnames > 'zin') weren't collected. This means that there could be other problems lurking under the surface of the data for the October run, such as other missing chunks of information. Yuck.
The good news is multifold:
(a) we found the problem (yay);
Submitted by megan on March 6, 2005 - 2:27am
Last September, right about the time we started up OSSmole, Sourceforge sent out a monthly email newsletter that included this observation:
(9/20/2004) Welcome to the September sitewide email. September is typically our busiest month for new traffic on SF.net. Students are arriving at college and getting on high speed connections. Open Source developers and consumers of Open Source software are returning from
their summer vacations. If you are back from vacation, it's good to have you back.I was of course reminded of
The Long September on usenet. Early participants on usenet began noticing that every September a new wave of cluless college students would flood in and ask dumb questions and make life miserable for a couple of months each year (until 1993 when usenet was made available to AOL users and so-called "The Long September" was born).
The SF message above talks about lots of "new traffic" on SF.net during September, but I'm not sure how "new traffic" is defined. It could mean generic web site traffic, as in "new users visiting the web site". Or it could mean "new projects being built", or it could mean "new users signing up". Or it could be some vestiges of September memories from usenet. Or, most likely, some combination of all of these things.
Submitted by megan on March 4, 2005 - 10:11pm
I'm experimenting with making some graphs of the data we've collected.
Here is a graph of the growth in programming languages used on Sourceforge projects from October 2004 until January 2005.
 click for a full-size image
Here is a graph showing the growth in the number of projects added per month to the Sourceforge repository from November 1999 until January 2005.
 click for a full-size image
Here is a graph showing growth in total numbers of Sourceforge projects, by month, from November 1999 until January 2005.
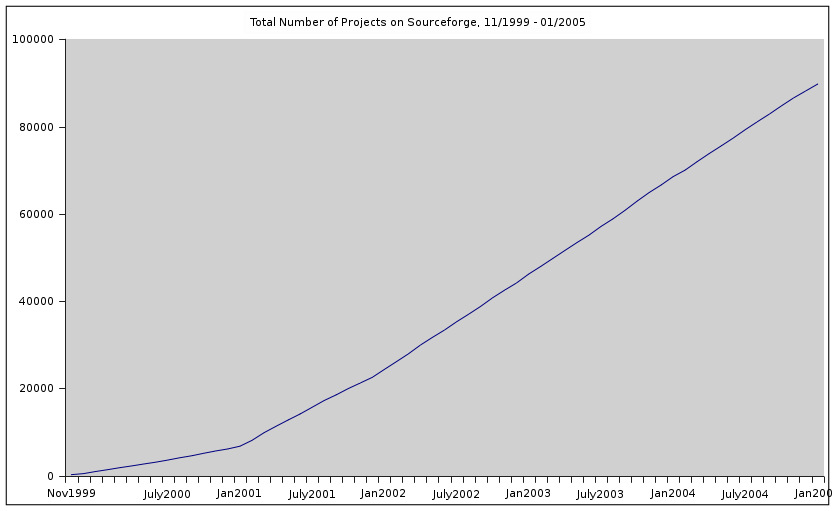 click for a full-size image
Submitted by megan on February 24, 2005 - 3:06am
The January 2005 Sourceforge summary reports have been posted:
Submitted by megan on February 23, 2005 - 2:01am
We have issued a new release of raw data files on sourceforge projects.
- Raw data: full lists of projects and programming languages used, operating systems used, target user interfaces, etc. The information included is for the October 2004 run and the January 2005 run. Download raw data files here
Pages