Submitted by megan on July 12, 2017 - 1:57pm
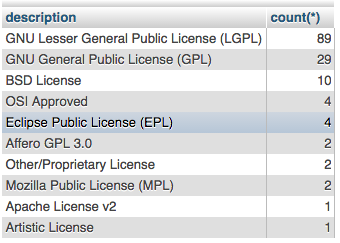
RubyGems collections for datasource_id # 61243 (July 2017) have been updated. They can be found in the database in the "rubygems" schema, or as flat files (latest datasource_id only) on the FLOSSmole data server.
Some sample queries:
Submitted by megan on June 29, 2017 - 9:47am
Submitted by megan on June 26, 2017 - 12:48pm
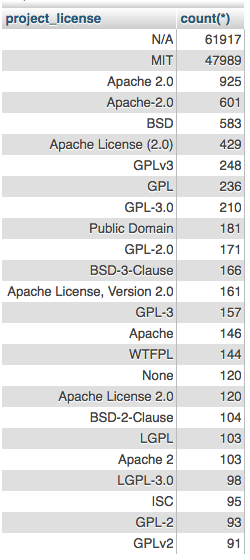
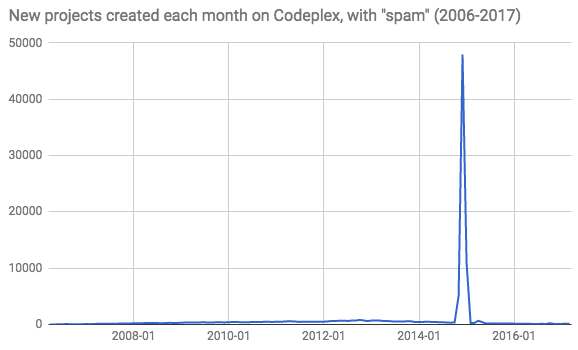
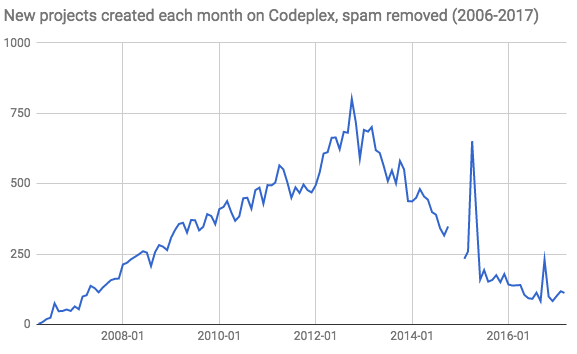
Codeplex was Microsoft's open source code forge. It began in 2006 and shut down in 2017. We collected the data at the time of shutdown, and provided it here at FLOSSmole for anyone to use.
Data is available in raw format or in the FLOSSmole database.
Sample graphics
Submitted by megan on January 26, 2017 - 6:51pm
Project creation dates for every Google Code project from February 4, 2011 (when they first started tracking project creation dates) and when Google Code was shut down March 12, 2015.
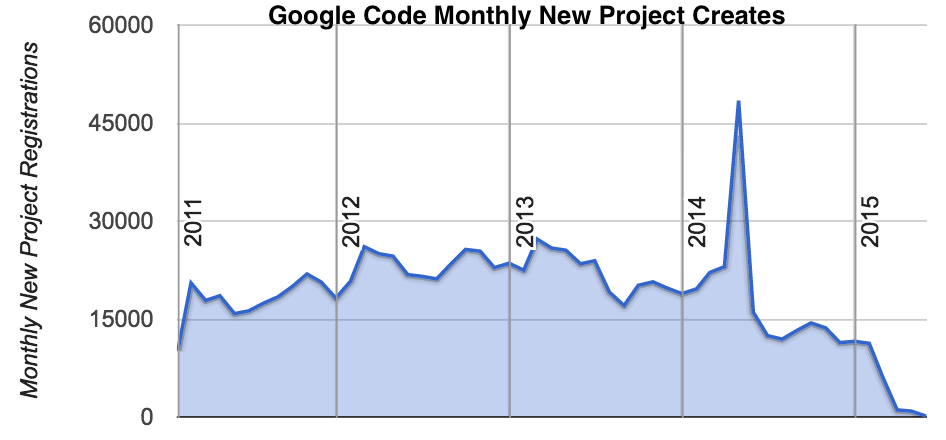
Click to enlarge
Submitted by megan on August 17, 2016 - 3:58am
We presented this paper at the 2016 OpenSym this week.
Schneider, D., Spurlock, S., and M. Squire. (2016). Differentiating Communication Patterns of Leaders on the Linux Kernel Mailing List. In Proceedings of the 12th International Symposium on Open Collaboration (OpenSym 2016).
Submitted by megan on July 21, 2016 - 2:01pm
With the FLOSSmole Apache Project/Contributor/Roles data we updated earlier today, we thought an interesting initial analysis would be to figure out how various corporations populate the Apache projects (at least according to the official lists of contributors posted on each Apache project page).
Here is a list of the Apache projects with the highest density of participation by a single corporation:
Submitted by megan on July 21, 2016 - 12:39pm
I spent a few days in May updating the list of all the Apache project contributors (full name & Apache system name when available) and their organizations when available. This data set was first released in 2013 in the MSR paper entitled "Project Roles in the Apache Foundation: A Data Set".
Fields:
Submitted by gbatchelor on July 1, 2016 - 10:31am
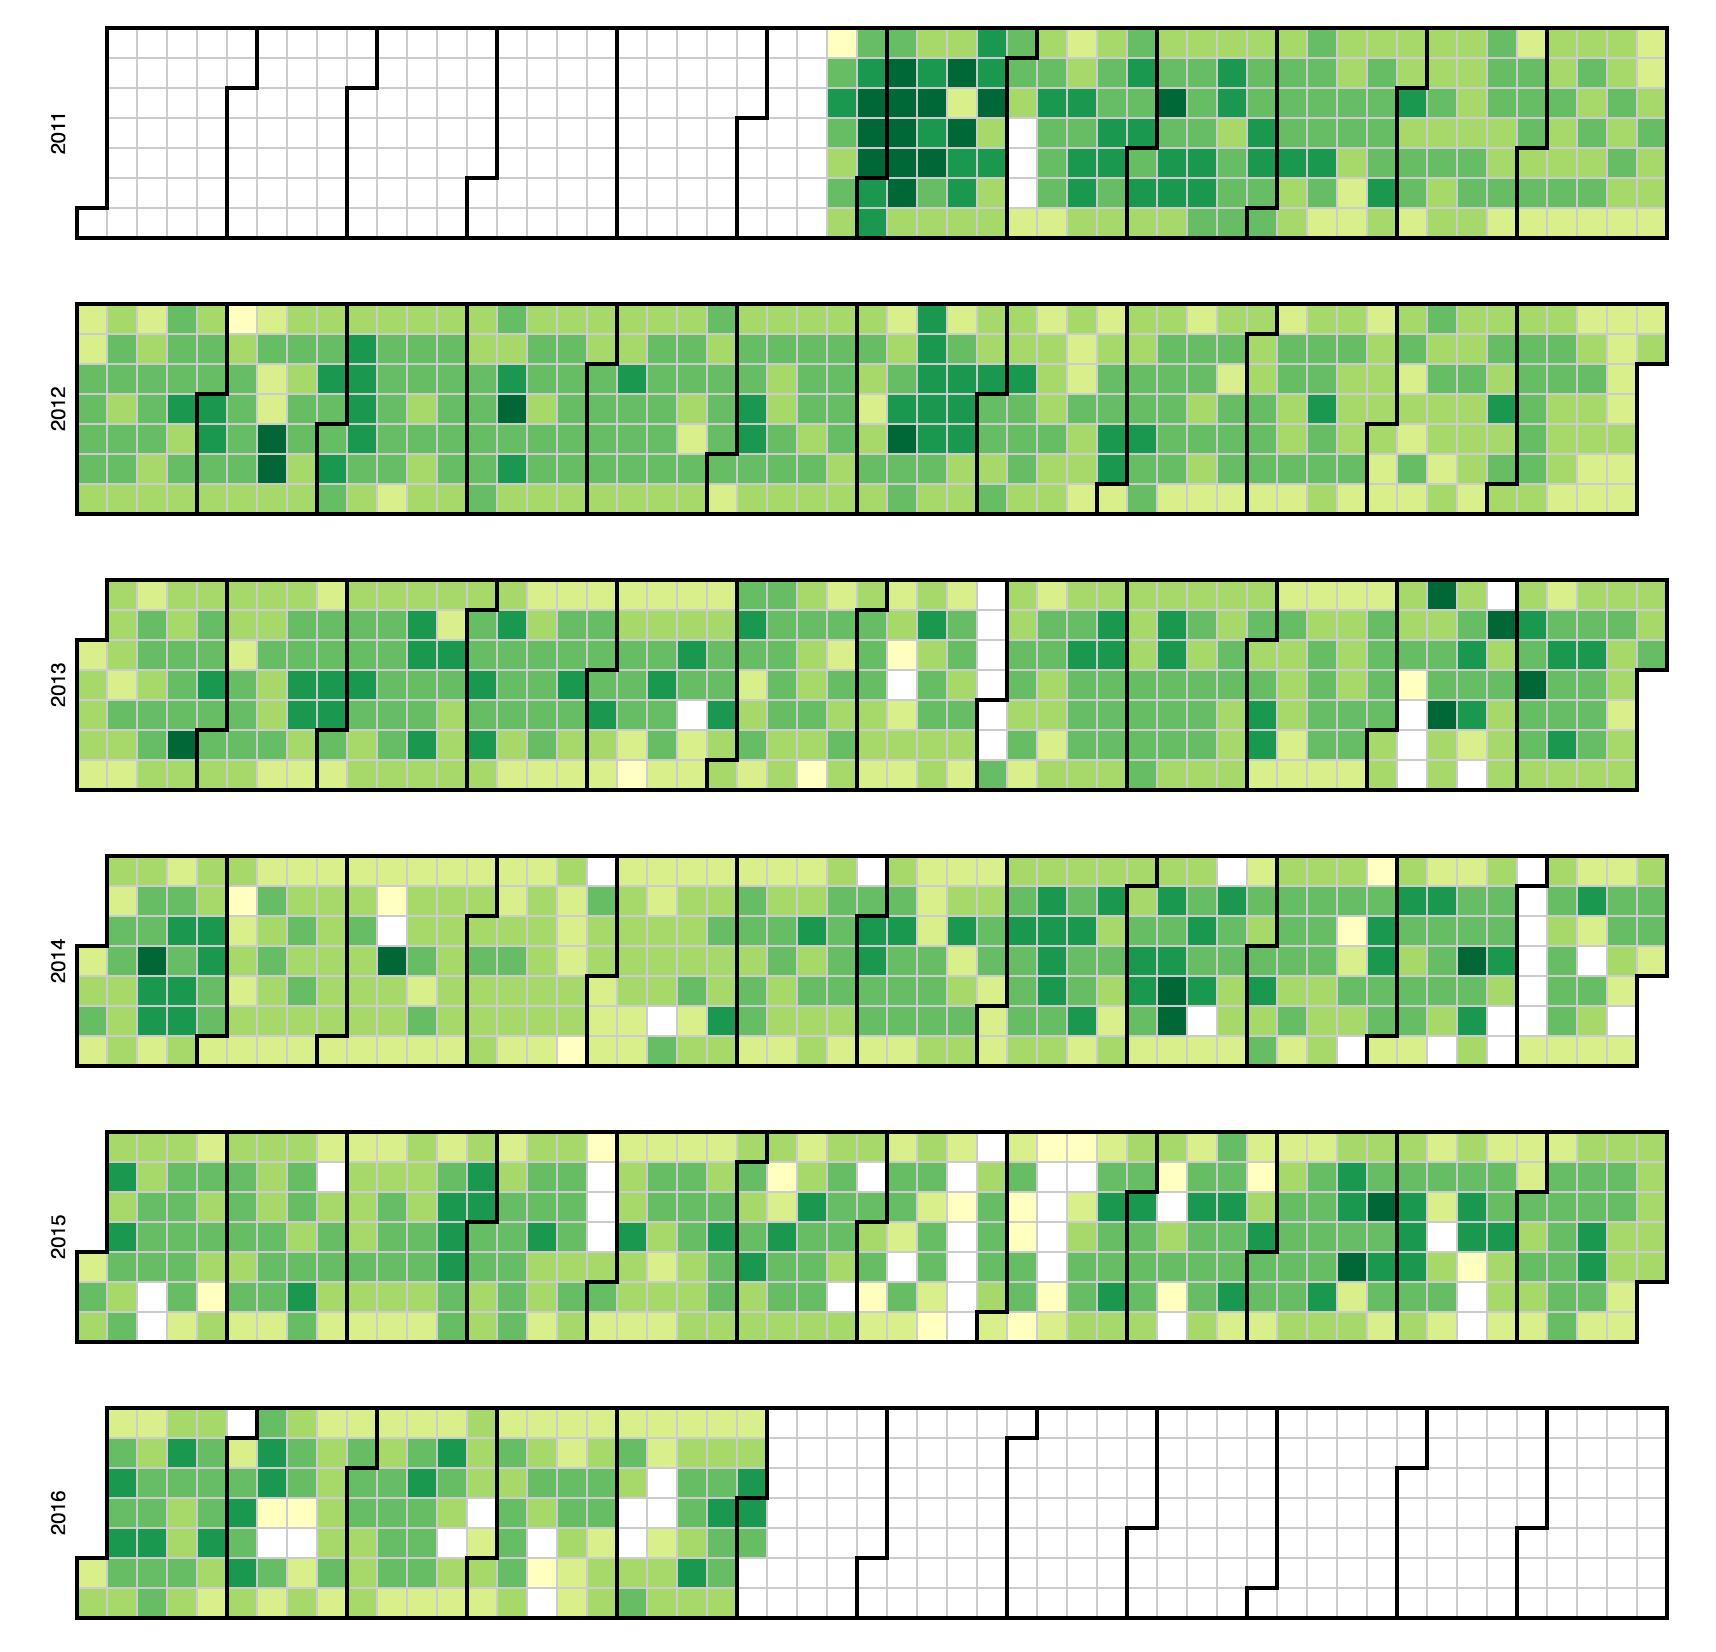
Django IRC D3 CONTRIBUTIONS GRAPH
This graph represents The number of posts in the Django IRC logs. The lighter green squares represent days with less posts than the darker green squares. Months go from left to right and are separated by the darker lines. Days go by columns from left to right.
Submitted by gbatchelor on June 29, 2016 - 11:41am
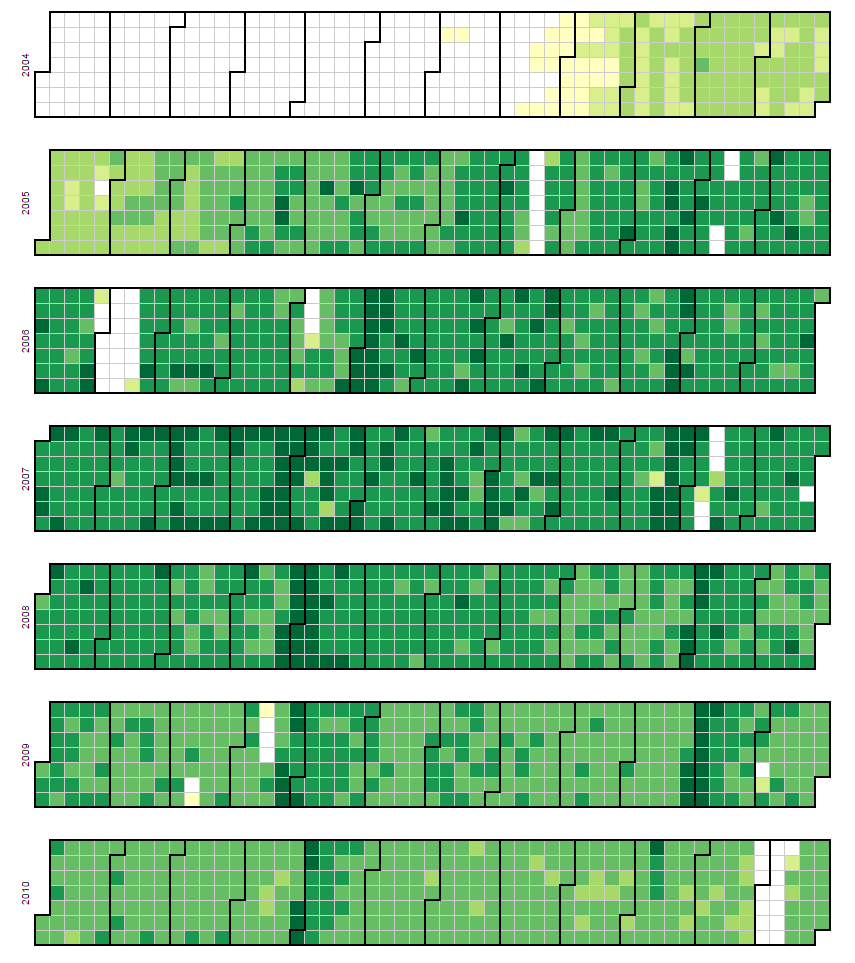
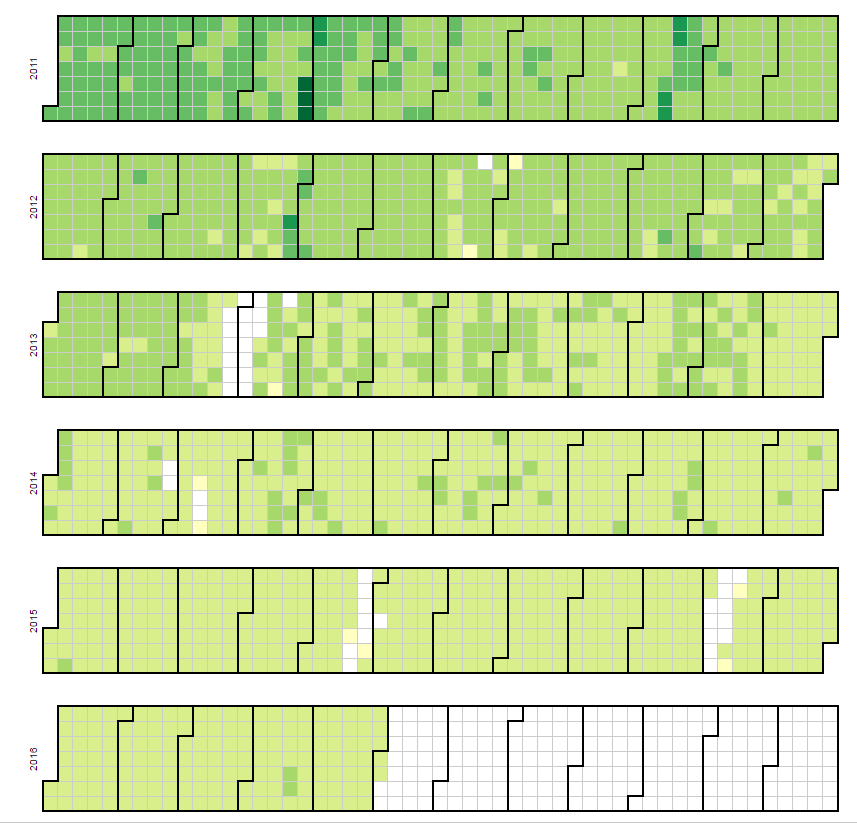
Ubuntu IRC D3 CONTRIBUTIONS GRAPH
This graph represents The number of posts in the UbuntuIRC logs. The lighter green squares represent days with less posts than the darker green squares. Months go from left to right and are separated by the darker lines. Days go by columns from left to right.
Submitted by gbatchelor on June 28, 2016 - 9:36am
The following are a few examples of some quick queries and visualizations we made to show how to use the Perl6 IRC data.
(1) Posts by hour of day over the years


SQL code:
SELECT YEAR(`date_of_entry`),HOUR(`time_of_entry`),COUNT(HOUR(`time_of_entry`))
FROM `perl6_irc`
GROUP BY 1,2
(2) Perl6 IRC Posts by hour
Pages


